
Video analytics are critically important to understanding how your videos are performing. With this new feature release, it’s now very easy to get a sense of how your videos are being viewed across the internet and around the world. Keep reading for details on the new analytics reports available, and ways you can use the data.
What Video Analytics Data Can I Track?
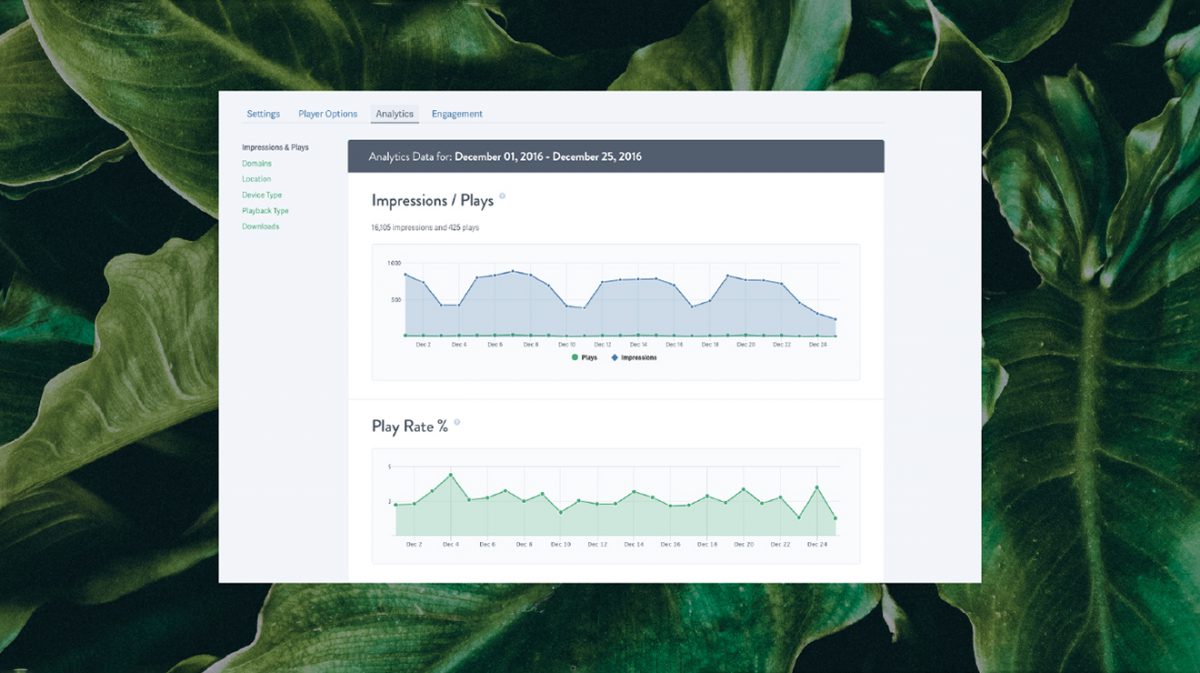
SproutVideo offers robust reporting on important metrics for your videos. You can now see the following data points in clear, easy-to-read graphs for all videos account-wide, or for an individual video:
- Total and unique impressions over time.
- Total and unique plays over time.
- The play rate of your video (total plays divided by total impressions)
- The most popular videos for a given time period.
- Where on the internet your videos were played.
- Where in the world your videos were played.
What Do Those Metrics Mean?
An impression represents the number of times your video loaded on a page. It indicates that someone browsing the internet opened a webpage that contained your video. Another way to think of it is that someone had the opportunity to play your video.
A play means that someone clicked on the video to watch it. It does not indicate how much they watched of the video (for that you’ll need our video engagement metrics), but it does tell you they were at least a little interested in the content.
The play rate of a video is calculated based on the two previously mentioned data points. If a page containing your video loads ten times, and your video is played twice, you’d have a 20% play rate. A high play rate is usually a good sign that your video is performing well.
We determine which videos are the most popular in a given timeframe based on the number of plays they get. It’s simple, but it let’s you know at a glance which videos your site visitors are choosing to watch.
In order to tell you where your videos are being played, we keep track of the domain where the video player was located when the playback session occurred. You’ll see a report indicating all the different URLs, and the percentage of plays that occurred on each domain.
Since video is a truly global phenomenon, we provide a handy map that will tell you where in the world your viewers were located when they watched your videos. You can drill down to the Country, State, or even City level, if that data is available.
How Can I Use Analytics Data to Improve Video Performance?
Although we love charts, all those numbers would be meaningless if you couldn’t put them to use for your business. Here’s how you can improve video performance with video analytics.
To grow the number of impressions your videos are receiving, consider ways to increase traffic to the page where they are located. You could share your video on social media, target influencers in your space, or send an email campaign featuring the video.
Ideally, increasing traffic to the page will also grow the number of plays your video receives. If you find that your play rate is not increasing at the same rate as the traffic to the page, you have several options. For instance, you could move the video player above the fold, change the poster frame, or adjust the design of the page to draw the eye towards the player. A clear call-to-action asking visitors to watch the video can also boost plays.
You can check out all the analytics data SproutVideo has to offer with a free 14 day trial of our platform. If you have any questions, we’d be happy to help! Just leave a comment below, or reach out to our support team.