

Image Credit: slidesgo (freepik.com)
With SproutVideo’s engagement metrics, you can now answer some fundamental questions about your videos. Are people watching the whole video or are they leaving before your call to action? Are there certain points in the video that people watch over and over? What other videos of mine has this viewer watched?
Starting today, you’ll be able to answer those questions and more using our video engagement analytics. With this new tool, you can not only see aggregate data for all views of a particular video but data for each individual play of your video as well.
All About Video Engagement Metrics
SproutVideo offers really robust high-level analytics that allow you to see where your viewers are located, how many impressions and plays your videos received, and where on the web your videos were watched. That data can be really useful. But, what if you want to understand your audience at the individual level?
That’s where video engagement metrics come in. For each of your videos, you can easily tell at a glance how engaging your content was. You can see if people skipped or rewatched specific parts of your video. You can also determine the browser, device, operating system, IP address, and physical location of each of your viewers.
Aggregate Video Engagement Metrics
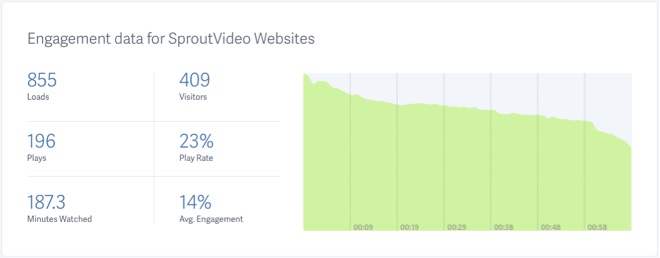
The aggregate data makes it easy to determine how engaging your video is in general. You can also see where people drop off while watching the video, as well as how many people, after seeing your video, actually play it.
In the example above, you can see that the video was loaded on a page 855 times by 409 unique individuals. Of 855 times the video was loaded on the page, the video was played 196 times. This results in a play rate of 23%. Not too shabby!
The green graph indicates the average level of engagement for each second of the video. This is calculated by tracking data about each playback session for each second of the video. You can see that engagement declines somewhat throughout the course of the video, and drops off slightly towards the end.
Analyzing Individual Viewers
With the individual play engagement data, you can easily see which parts of the video were watched, skipped, or re-watched. You can also see where and when the play took place, as well as what device was used to watch the video. Lastly, you can see how many of your other videos the viewer has played.
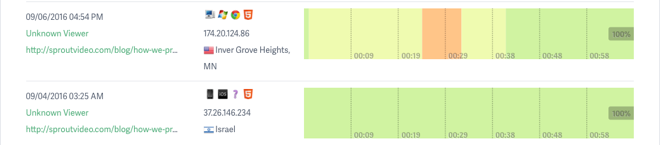
The different colors in the heatmap indicate that parts of the video were watched more than once. In the above example, you can tell that the first viewer watched the first part of the video, colored in yellow, at least twice. They also rewatched another chunk, indicated by the color orange, three times. In comparison, the second viewer watched the whole video in its entirety. They did not rewatch any of it.
You can go even further and tag viewers with a name and email address so you can easily keep track of them. You can either manually tag viewers or have them be automatically tagged using our login protection feature or by passing in a parameter into the embed code. Please refer to this help article for more information about tagging and tracking individual viewers by email address.
We believe our new video engagement analytics will not only help you gain meaningful insight into how people are watching your videos. They also give you actionable data. You can use this new information to alter your videos to be more engaging.
If you’re interested in testing out the power of video engagement metrics for yourself, get started with a free trial of our platform today. Questions? Please ask us in the comments below, or contact our support team.