Video metrics tell the story of how viewers interact with your video. They serve as key performance indicators (KPIs) for videos that provide direction as you review the data, test strategies to enhance engagement, and increase ROI.
From learning and development to operations, technology, and support — video metrics are essential for tracking the effectiveness of video content.
Learn how to use video metrics to evaluate video content. Analyze and measure performance with these top five video KPIs for tracking and improving success.
Top Video Metrics to Measure Performance & ROI
Why Are Video Metrics Important?
Video metrics help you evaluate the performance of your content and where to optimize it. They provide visibility into what’s working so you can replicate those results and boost ROI.
Marketers can use video performance data to segment their audience, tailor marketing campaigns, and create predictably successful video content. But it’s not just marketing that benefits from employing video metric insights.
Businesses and organizations use video metrics to:
- Track student or employee engagement with training videos
- Evaluate the effectiveness of customer support demonstrations
- Audit secure communications across departments or branches
- Maintain compliance within regulated industries
- And much, more more.
🎯 Use Cases for Business Videos + Metrics to Track
5 Video Metrics to Measure Engagement & ROI
1. Play Rate
Play rate answers the first question of video engagement, “are people clicking play?” It represents the total plays as a percentage of the total impressions.
Plays / Impressions = Play RateFor example, an e-commerce brand includes a demo video on every product page. When visitors land on the page, they can play the video to learn more about the item. If 250 people visit the page and 50 click play, the play rate is 20%.
50 Plays / 250 Impressions = 20% Play RateWhat Is A Good Video Play Rate?
SproutVideo customers from diverse industries see an average play rate of 30%.
3 Ways to Optimize Play Rate
- Thumbnail: Thumbnails are the billboard for your video. Create a consistent design tone to build trust with viewers. Test various thumbnail elements (graphic elements, text, tone) to see what performs better with your audience.
- Copy: Provide context and improve the viewer’s expectations of the video by changing the video title, description, or accompanying text. Use this copy to convey the value of the video and encourage readers to click play.
- Content Alignment: Align the video topic with the page where it’s located. For example, the e-commerce brand places a video ad on a product page. It has a decent play rate but the conversion rate is low. The brand replaces the ad with a product demo. The video’s play rate and the conversion rate increases significantly.
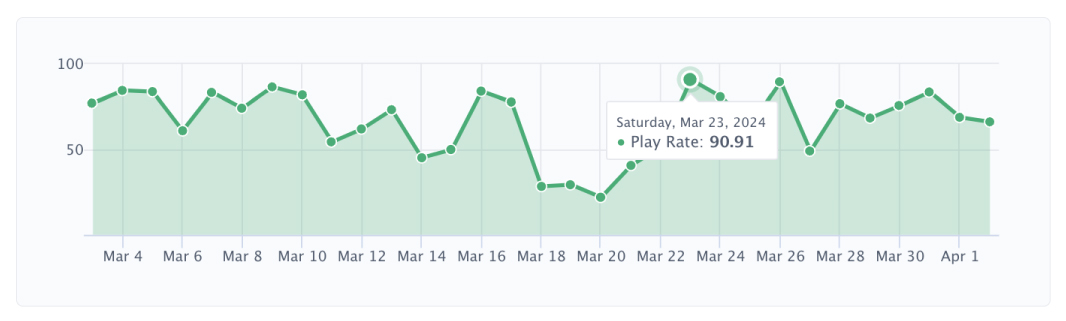
On the SproutVideo platform, you can set a custom date range to compare play rate data before and after optimization strategies are employed, making evaluating their effectiveness easy.
Unique Play Rate
Unique play rate accurately evaluates how often your audience plays a video by filtering out repeat visitors. This metric helps you evaluate what percentage of your audience was compelled to click play on your video, whether due to its topic, placement, or thumbnail.
For example, a marketer evaluates the performance of an explainer video on a client’s homepage. The play rate is low (4%); however, the marketer remembers that many people revisit the client’s website for other purposes.
He checks the unique play rate, which is 65%. Over half of the individuals who visit the website watch the video. This data lets the marketer contextualize the information and showcase positive results to his client.
2. Average Engagement Rate

Are people watching your video from start to finish?
Average engagement rate measures how much of your video viewers watch. It is the most useful metric for determining how your audience engages with a video. Indeed, 60% of marketers use engagement as the key performance indicator (KPI) when measuring success.
[Total Mins Watched / (Unique Views X Video Length)] X 100 = Avg. Engagement RateFor example, a media company sends a one-minute advertising pitch to ten potential sponsors. Half of the sponsors watch the whole pitch; the remaining half watch 30 seconds.
Therefore, the total time spent watching the video is seven and a half minutes — out of 10 potential minutes. The average engagement rate is 75%.
[7.5 Mins Watched / (10 Unique Views X 1-Min Video)] X 100 = 75% Engagement RateHowever, suppose three of the potential sponsors rewatch the one-minute video. In that case, they will contribute an additional three minutes of watch time, increasing the average engagement rate to 105%. In this way, the average engagement rate can be over 100%.
[10.5 Mins Watched / (10 Unique Viewers X 1-Min Video)] X 100 = 105% Engagement RateOn the SproutVideo platform, an engagement chart showcases the average engagement rate across the video’s duration. It allows you to determine what parts of the video are most engaging to your audience.
Note: Average engagement rate is automatically calculated for SproutVideo users. The data graph (picture above) shows average engagement rate at any point in the video.
What’s A Good Video Engagement Rate?
SproutVideo customers from diverse industries see a 58% average engagement rate across a wide variety of video durations.
Note that this data does not include average engagement for rewatches.
How to Optimize Average Engagement Rate
Like the image above, engagement charts are usually on a slope: the largest number of viewers start watching the video and gradually dissipate.
Look for drop-off points and engagement spikes in the data to improve your average engagement rate. These can significantly inform your video creation process.
- Drop-off Points: Sudden drop-off points indicate that many people leave simultaneously. Review the video to determine why. Does the information become redundant, overwhelming, or offensive? Identify the culprit and update the video.
- Engagement Hills: In the graph above, notice the engagement “hills” on the otherwise downward slope. Whereas peaks (sharp engagement increases) may indicate less engagement with the rest of the video, engagement hills highlight sections with increased interest or value added.
- Engagement Peaks: Similarly, engagement peaks showcase where the most viewers tuned into the content; however, peaks also indicate lower overall engagement with the rest of the video. Determine why viewers are flocking to that part of the video. Often, peaks represent the core informational value the video provides. A more concise video may offer the same value in less time while increasing engagement.
If you see a change in engagement at a specific timestamp, examine what is happening at that point in your video. Perhaps you:
- Placed a call to action
- Introduced a new character
- Changed music
- Droned on a bit too long
- Provided a nugget of significant value
The data will guide when to tighten your edits, sharpen your hooks, and refine your message to ensure viewers keep watching the entire video.
A Note on Completion Rates
Some platforms use completion rate metrics instead of average engagement rate. However, completion rate doesn’t capture how much of the video viewers watched.
For example, if the media company (from the example above) used completion rate to evaluate if sponsors watched the video, they would conclude that only 50% completed it. After all, half of the sponsors only watched 30 seconds. Yet 30 seconds was plenty of time to review the most valuable information for those particular sponsors.
In other words, this data doesn’t help determine how viewers engage with a video.
Outside of compliance requirements, viewers don’t need to watch every second if they receive the value or information they anticipated. To this end, the average engagement rate accurately evaluates how much (and what parts) of the video viewers watched.
3. Heat Maps
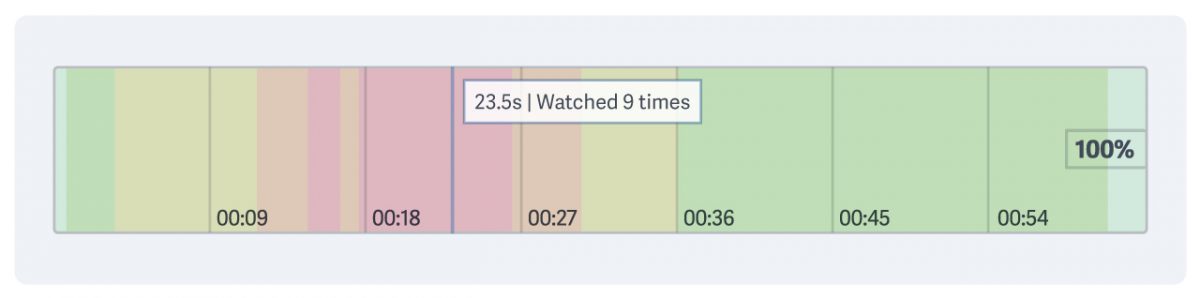
Heat maps display a cool-to-warm visualization of engagement data. It also showcases the percentage of the video content the viewer watched during a single viewing session.
Heat spots, identified by the warmer colors below, indicate where the viewer rewatched content. Rewatches indicate areas of greater interest or sections of information that are too dense to absorb the first watch.
Heat maps offer helpful insights into user behavior. When paired with other individual session data, companies can measure the effectiveness of employee training, internal communications, marketing materials, and more.
For example, a videographer sends their portfolio to a potential client for review. The client immediately writes back to book the videographer. They want to know which video sold the client on their skills. The videographer reviews video heat map data and notices that the client watched a few seconds of many videos but only rewatched one. This information helps reveal what captured the client’s attention, plus the videographer uses this video to sell their skills to similar clients in the future.
How Experts Turn Video Views Into Profit

Tired of videos that feel like a rigged carnival game? Discover expert strategies for turning video into a growth engine across any industry.
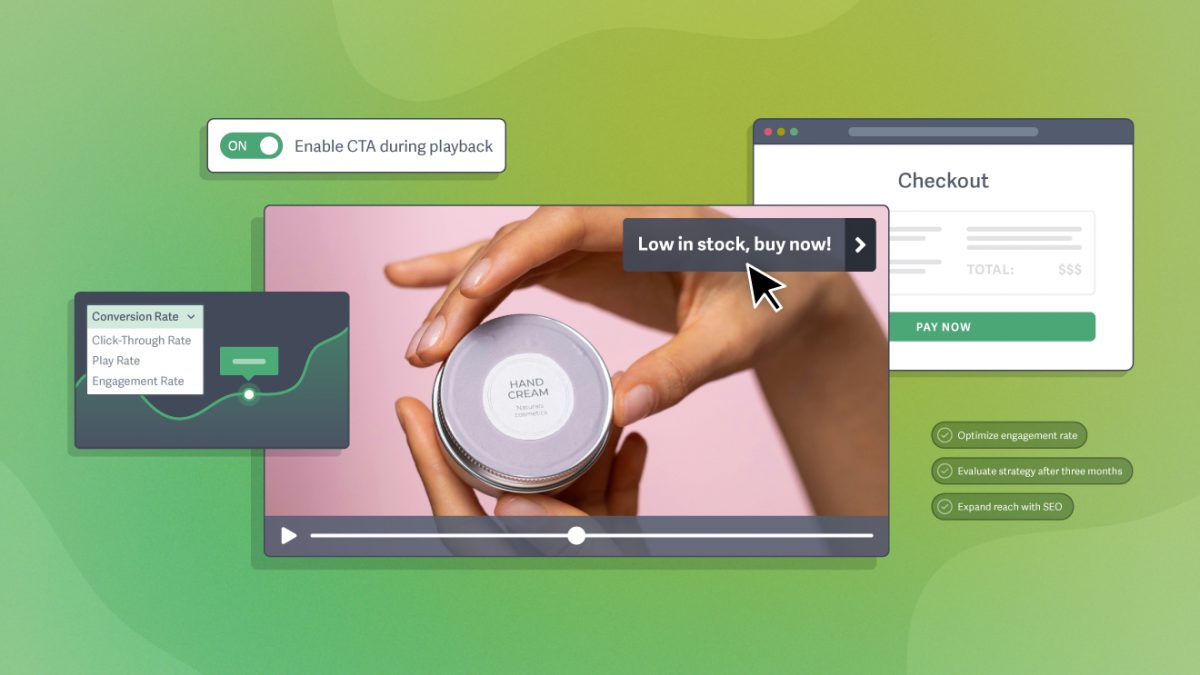
4. Click-Through Rate
Click-through rate measures the percentage of viewers who click on a call-to-action (CTA) prompted by your video. This metric is important if you use video to encourage specific actions.
Depending on your video goals, you may want viewers to:
- Follow an in-player call to action
- Click on the post-play screen
- Select a button or link on the video’s webpage
When brainstorming effective calls to action, keep in mind that viewers will only click the CTA if it is relevant to the video content already holding their interest.
How to Measure Click-Through Rate
Track unique users to the page where you send traffic, as well as the source of the traffic. Use Google Analytics or your website hosting service to find this data.
Combine this information with video metrics to determine if there is a correlation between viewers watching your video and landing on the intended page or offer.
(Page Users from Video / Unique Video Plays) X 100 = Click-through RateFor example, a web developer’s promotional video includes an in-player CTA that directs traffic to a contact page. She compares data from her video to the unique numbers of users who visit her contact page from that source.
Her promo video receives 50 unique plays. Her website analytics reveal that ten users landed on her contact page from the link in her in-player CTA. She deduces that her video is producing a 20% click-through rate.
(10 Page Users from Video / 50 Unique Video Plays) X 100 = 20% Click-through Rate5. Conversion Rate
Conversion rate measures how effectively your video persuades viewers to complete a specific action. This metric is essential for businesses, as it showcases how video affects a bottom line.
Depending on your video goals, you may want viewers to:
- Subscribe to receive additional resources
- Request a demo or sign up for a free trial
- Make a purchase or become a paid member
For example, a viewer stumbles upon a blog post with a how-to video. During the video, a CTA offers a free resource for new subscribers. They follow the CTA to a sign-up page, enter their email address, and receive the free resource in their inbox.
They successfully converted!
How to Measure Conversion Rate
To determine the conversion rate: track unique users to the page where you send traffic, the source of that traffic (i.e. your video), and visitor behavior (whether or not they complete the action). You can use UTM parameters to segment the traffic to ensure your conversion rate only considers traffic from users who played the video.
(Users Who Complete Action / Unique Video Plays) X 100 = Video Conversion RateFor example, 100 people watch a video. Twenty people click through to a sign-up page promoted with an in-player CTA during the video. Ten of the 20 people who click through to the page sign up. Therefore, 10 of 100 potential people converted, or 10%.
(10 Users Who Complete Action / 100 Unique Video Plays) X 100 = 10% Conversion RateUse Google Analytics, your website hosting service, and your payment provider (i.e. Stripe, PayPal, etc.) to find this data. Compare this data with video metrics to determine if there is a correlation between unique users watching your video and taking the prompted action.
Live Video Streaming Metrics
Businesses and institutions use live streams across departments for student and employee training, hosting community events, sharing private information with shareholders, and marketing campaigns.
Learn how to evaluate and improve your strategy in this live stream analytics guide.
How to Use Video Metrics to Improve Engagement & ROI
Video metrics provide valuable insights into what’s working and what needs improvement. Here’s how to use video metrics to evaluate and improve your videos:
- Employ engagement strategies in a new video or by replacing an old one.
- Track and evaluate how each strategy affects performance over a period of time.
- Recreate your results to determine strategies that lead to stronger performance.
3 Strategies to Improve Video Engagement
Research shows that the following strategies work across industries and audiences. Discover eight more engagement strategies in our article.
- Hook Viewers in the Opening or Introduction. Why is this topic enticing, valuable, or entertaining? Introduce or illustrate the core idea right away to increase engagement.
- Expand Video Reach with SEO. Organic discovery puts your content in front of people who are directly seeking it, making them more likely to engage with your video.
- Optimize Videos for the Intended Distribution Channels. If you plan to share a video across multiple platforms, create separate versions to optimize it for each channel.
🌱 Keep Reading: 10 Strategies to Improve Video Engagement
Give your video content superpowers: grab our 30-day truly free trial. Or learn more: