Your biggest fans and most engaged audience participate in live streams.
People who engage in your live stream are 43% more likely to buy a premium product. Furthermore, research on student learning shows that live streaming is “highly effective” while boosting creativity and cooperation.
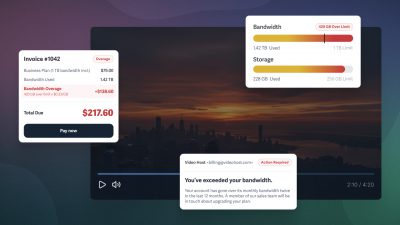
However, businesses with specific goals need live streaming metrics to measure success and inform strategy improvements. Across departments — marketing, learning and development, operations — these analytics help determine ROI, meet compliance standards, and maintain security measures.
Welcome to our walk-through guide on live streaming metrics. Learn what each metric measures, why it’s important, and how to use the information to meet your goals.
Live Streaming Metrics That Matter & How to Use Them
- Quick Look: Top Metrics to Review Performance
- 15 Metrics to Measure the Success of Your Live Stream
- Currently Watching
- Peak Views
- Unique Visitors
- Average Time Watched
- Live Chat Participation
- Total Views
- Total Hours Watched
- Average Engagement Rate
- Geographic Location
- Domains Where Viewed
- Device Type
- Date Viewed & Time Stamp
- Viewer Name with Total Sessions Viewed (When Captured)
- IP Address
- Heat Maps
- 5 Live Streaming Use Cases for Business + Metrics to Track
Quick Look: Top Metrics to Review Performance
Quickly determine how a live stream performed with your audience. These metrics are helpful for evaluating attendance and engagement across use cases.
- Total Views: total number of viewing sessions during the broadcast
- Unique Visitors: amount of individual viewers
- Average Engagement Rate: percentage of live stream watched
Click on each metric above for in-depth information — or keep reading to find it in the full list of 15 metrics below.
Note: The metrics above are common across live streaming platforms. However, some of the metrics below are SproutVideo-specific.
15 Live Stream Metrics to Measure Success
Live stream metrics are organized into three categories:
- During the live stream (real-time analytics)
- After the broadcast ends (post-live stream metrics)
- Data for each viewing session (individual viewer data)
Click on any of the links above to jump to that section.
Real-Time Live Stream Analytics
When evaluating the metrics below, higher numbers are generally favored and indicate that you successfully promoted the live stream to your audience. Additionally, more viewers equals more opportunities for people to engage and absorb your content.
Private live streams are the exception. In this situation, use real-time analytics to ensure the audience size doesn’t exceed the intended audience. Monitoring this data helps detect security leaks during a live stream with limited access.
Note: There is some overlap between the analytics measured in real-time and post-live stream. We discuss each metric in relation to real-time and post-live analytics when applicable below.
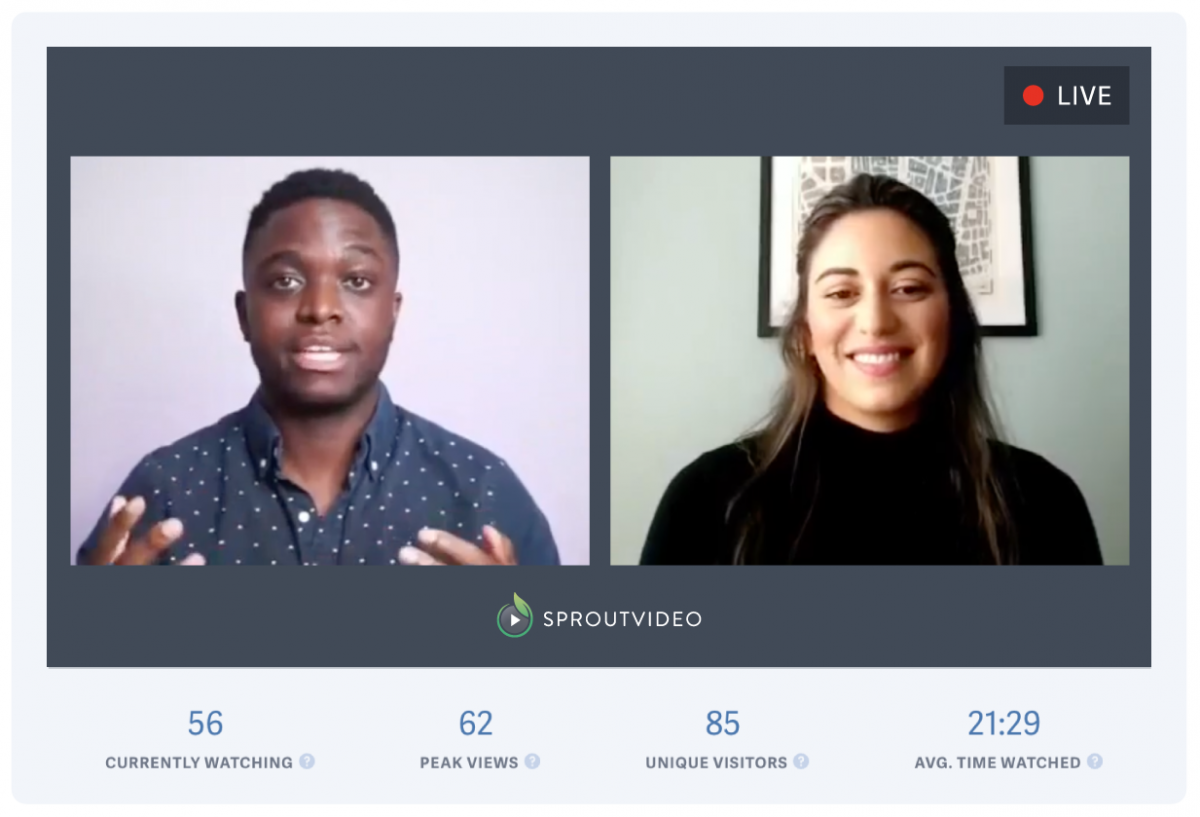
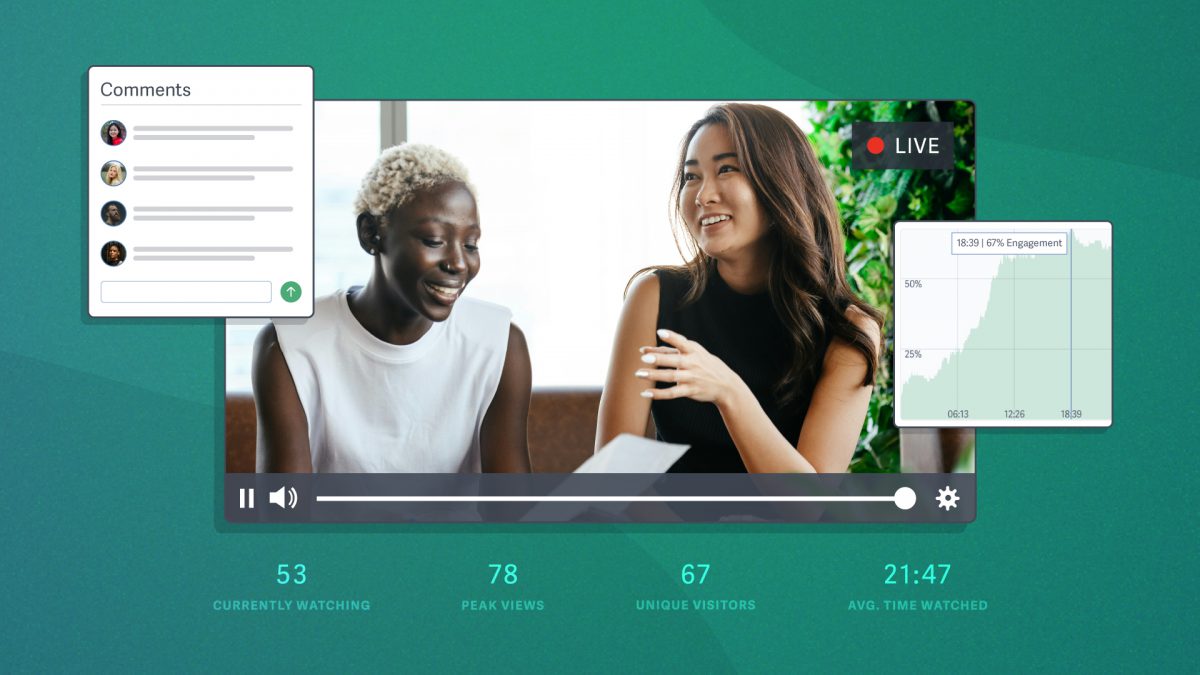
Monitor the following metrics during the live broadcast. These metrics are displayed directly below the live stream, so it’s easy to glance at the numbers while hosting live.
1. Currently Watching
The number of viewers currently watching your live stream (AKA concurrent viewers).
This metric monitors live viewing engagement. It lets you quickly see how many people are tuned in and engaging with your live stream.
This information is most helpful when starting a live stream. It is common to begin a broadcast and wait until a minimum number of viewers have joined before launching into the prepared material. This metric helps you determine when you’ve reached that minimum.
If this number suddenly drops to zero, an issue likely occurred during the broadcast.
Addressing Technical Issues in Real Time
There are very few reasons your live stream would be interrupted once you’ve configured a live stream and begun broadcasting. If you have an unexpected issue, such as changes to your device or losing the network connection, you must resolve the root problem to continue.
Luckily, you do not need to start a new live stream if you use 30-second latency on the SproutVideo platform. This latency option gives you five minutes to fix the issue and reconnect without starting a new live stream.
2. Peak Views
The highest number of concurrent viewers who join during the live stream.
Peak views represent the highest number of viewers who simultaneously watched the live stream up to the current point in the broadcast . After your broadcast concludes, it represents the highest number of people who watched your live stream at any time.
Peak views help you measure audience engagement during the broadcast. As this number updates, it indicates whether or not your viewing audience is still growing.
A high peak views count post-live stream suggests your content was engaging and attracted significant viewers. On the SproutVideo platform, you can use the analytics graph (pictured below) to quickly determine what part of the live stream attracted the most viewers.
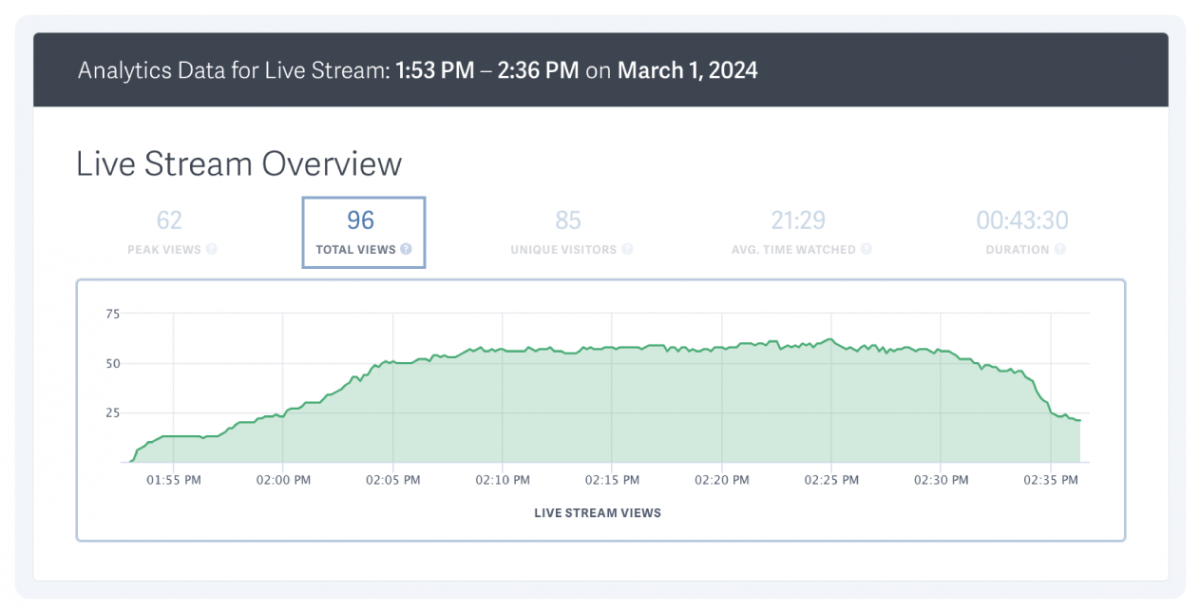
Across multiple live streams, this information can guide you in tailoring your content to match the interests of your viewers better.
Note: Currently Watching viewers and Peak Views measure non-unique viewers, meaning if a user plays the live stream in two browser windows simultaneously, it will count as two viewers or views.
3. Unique Visitors
The total unique viewers who watched your live stream during the broadcast.
Like peak views, this information helps you compare live streams and determine what topics perform best with your audience.
For example, a company is promoting a product launch, and 8,000 people register for the event. If 3,500 unique visitors attend (44%), it suggests significant interest in the product and successful marketing of the launch event.
For private live streams, monitor unique visitors during the broadcast to ensure your security measures work as intended.
4. Average Time Watched
The average amount of time viewers watch your live stream.
This metric tracks how long viewers watch the live stream and displays the average time watched in hours, minutes, and seconds.
If you notice the average time watched is low during the broadcast, you can employ more interactive techniques to reengage viewers and encourage longer viewing times.
You can also use this information to create more engaging live streams: determine if new engagement strategies are effective across multiple live streams.
5. Live Chat Participation
Unlike the rest of the metrics on our list, chat participation is qualitative data. Therefore, you base your insights on audience feedback rather than objective data.
Live chat creates a direct line of communication between you and the viewer during live streams. Direct interaction encourages audience participation and provides insights into their frequently asked questions.
Use this information to align your content strategy with your most engaged audience.
📌 How to Add Chat to Your Live Stream
How Experts Turn Video Views Into Profit

Tired of videos that feel like a rigged carnival game? Discover expert strategies for turning video into a growth engine across any industry.
Post-Live Stream Analytics & Engagement Metrics
On the SproutVideo platform, post-live stream metrics are organized into two dashboards: Analytics and Engagement.
The Analytics dashboard provides an overview of how many people watched the live stream.
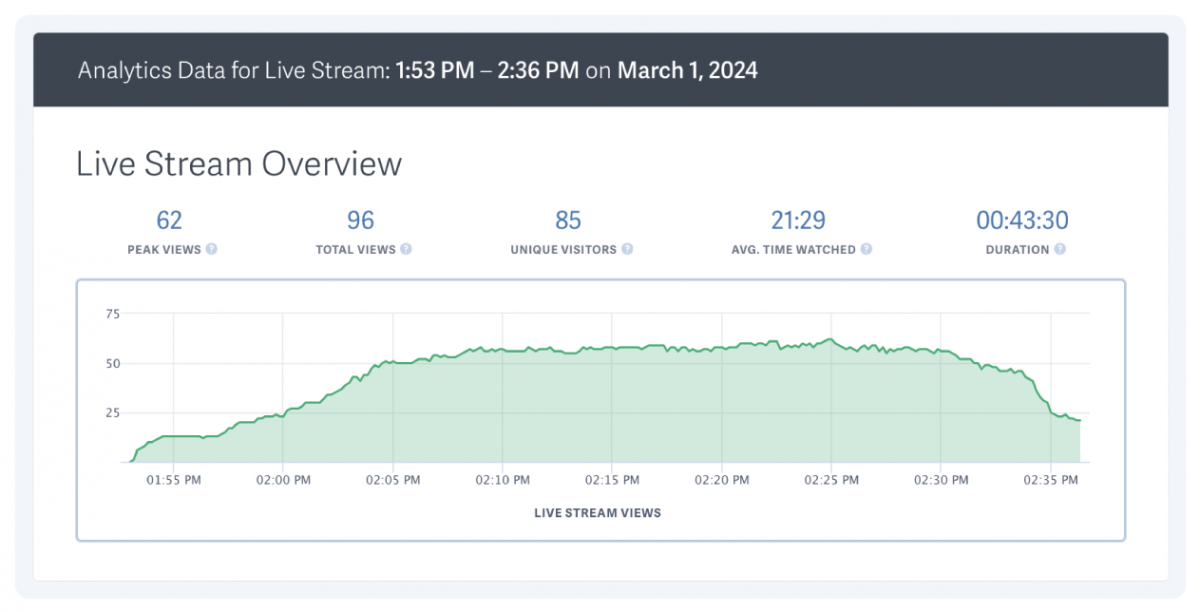
Analytics Dashboard on the SproutVideo Platform
The dashboard also includes graphs on the domains people watched from, what devices they used, and where in the world they tuned in from.
The Engagement dashboard features metrics on how many people engaged with your live stream and for how long; it also includes individual viewer data (more on this later).
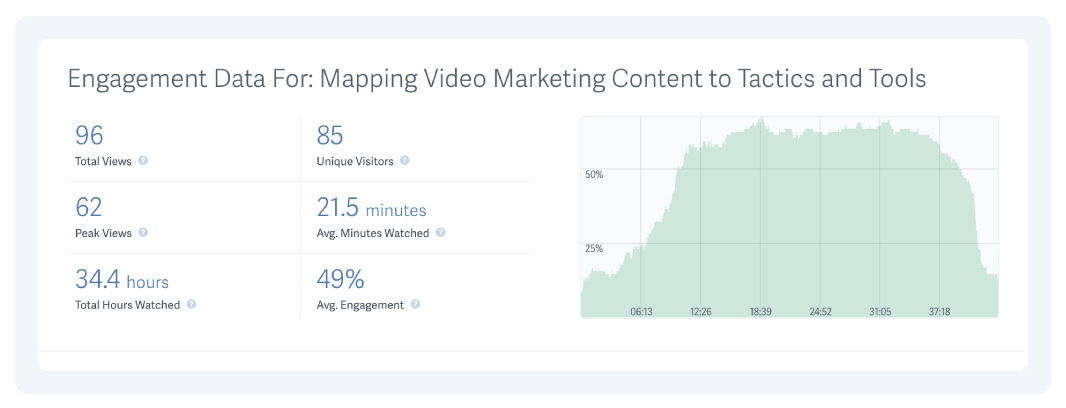
Engagement Dashboard on the SproutVideo platform
Some overlap exists between real-time and post-live analytics. These are Peak Views, Unique Visitors, and Average Time Watched. Click on any of the metrics to review them above. We’ll discuss the other available metrics and how to use them below.
6. Total Views
The total number of live stream views accumulated during the broadcast.
This information gives you a broad understanding of your audience’s interest in the live stream topic. A high view count suggests you successfully promoted the live stream to your audience, and it garnered enough interest for viewers to join live.
In this way, total views and unique visitors provide similar information. However, unique visitors will never exceed the total views (though they could be equal).
When there is a significant difference between these numbers, it might suggest that a substantial portion of viewers left and returned to the live stream during the broadcast.
However, it could also signal buffering or disconnection issues, a viewer switching devices, among other possibilities. Review individual session data by studying viewer behavior to create a more complete picture.
7. Total Hours Watched
The total amount of time all viewers spent watching the live stream.
Higher total hours watched are generally associated with greater engagement. This information is better contextualized as the average engagement rate (discussed next).
However, you can combine this information with individual session data to discover highly engaged audience members who spend more time watching your live stream than average. Heat maps make it easy to identify these viewers.
8. Average Engagement Rate
The average percentage of the live stream viewers watched.
The average engagement rate showcases the amount of your live stream that a single viewer generally watches. It’s one of the best metrics for determining audience engagement.
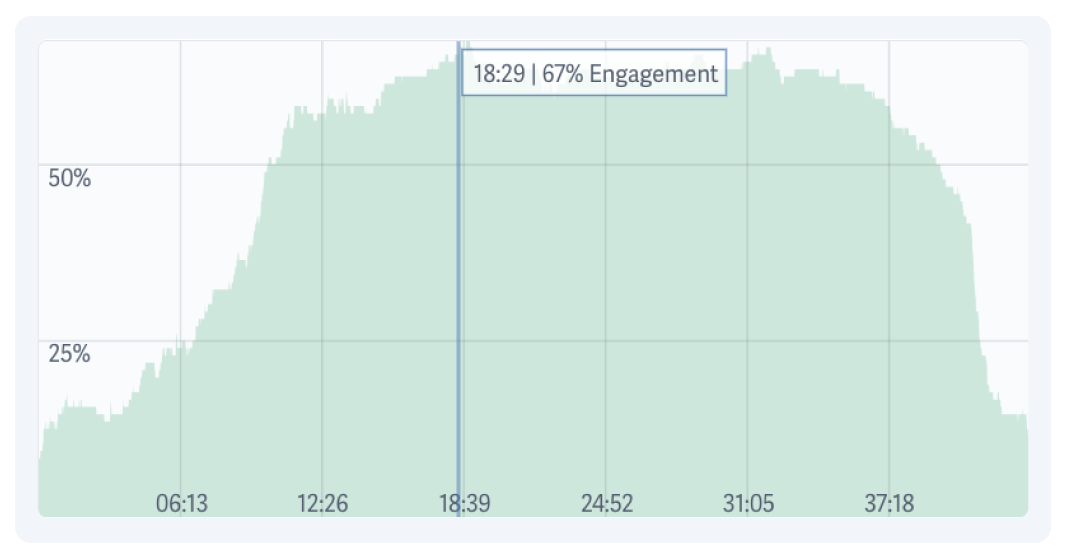
The SproutVideo platform provides a graph that displays the average engagement rate at every point of your live stream. This graph is a hugely useful tool for determining what parts of your live stream are most interesting to viewers.
Use this metric to determine what aspects of your live stream would benefit from additional engagement strategies and again to evaluate the success of those strategies.
Intros and Outros Affect Average Engagement Rate
Live stream intros give viewers time to join a live stream. Similarly, live stream outros often provide a wind-down period with room for Q&As. 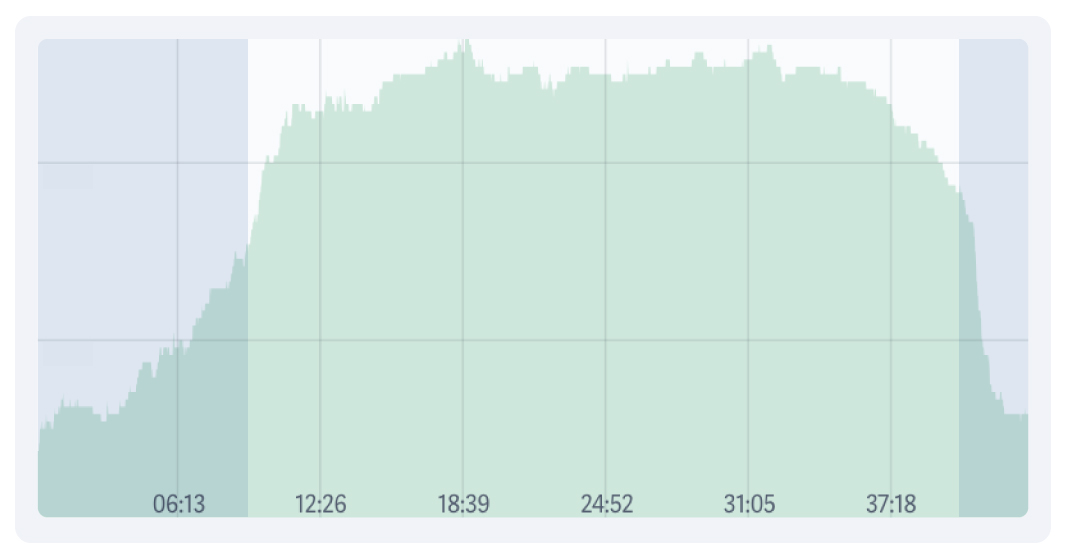 But this extra time at the beginning and end of your live stream can distort your average engagement rate. Here’s how to remove this anomaly from the data to give you a cleaner benchmark of your live stream’s average engagement rate:
- Subtract the duration of your intro and outro from the total video duration (60-minute live stream – 10-minute intro – 15-minute outro = 35 minutes of main content.)
- Divide “average minutes watched” by the duration of main content in your live stream (20 average minutes watched / 35 minutes of content = 57%)
Compare this engagement percentage to the reported engagement rate for the entire live stream duration, which is 34% (20 average minutes watched / 60 total minutes).
9. Geographic Location
A map of every country where your live stream played.
You can click each country from the world map on the SproutVideo platform to see specific regions where viewers watched your live stream.
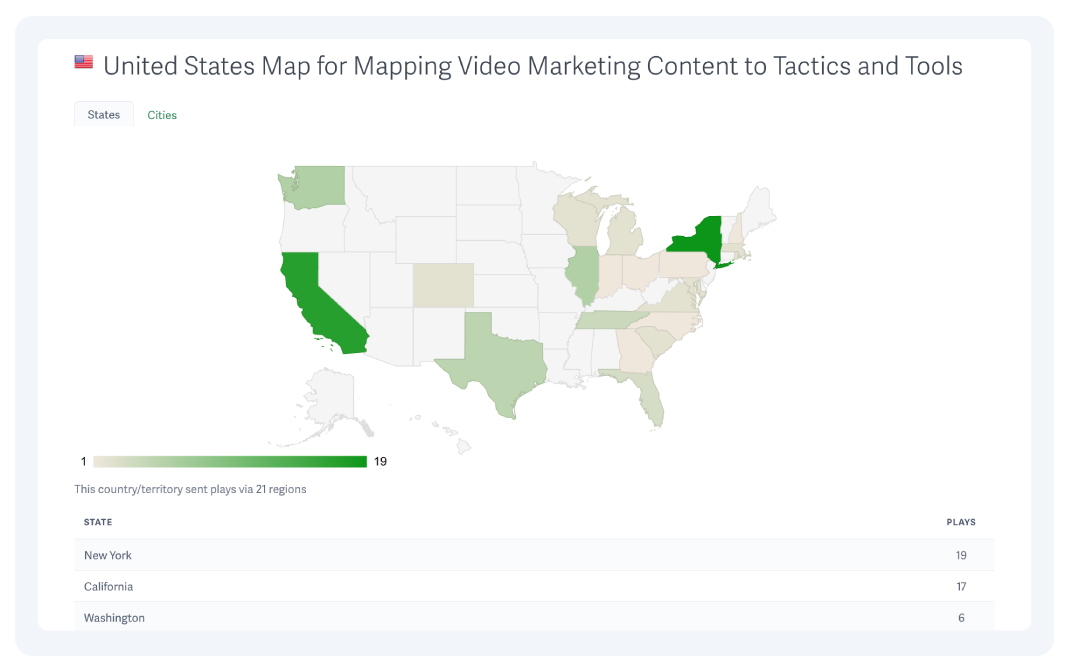
Local businesses that market within a specific region and multi-branch companies that must communicate internally and privately often use this metric.
Geographic location is also a helpful metric when gathering customer insights for tailoring marketing campaigns and understanding your audience.
Finally, geographic location is necessary to comply with state or federal regulations within relevant industries. Tracking geographic location is generally needed when ensuring your live stream reaches the correct audience.
10. Domains Where Viewed
Domains identify where your live stream was played on the internet.
If you embed your live stream in multiple places, this metric is ideal for determining what channels generate views.
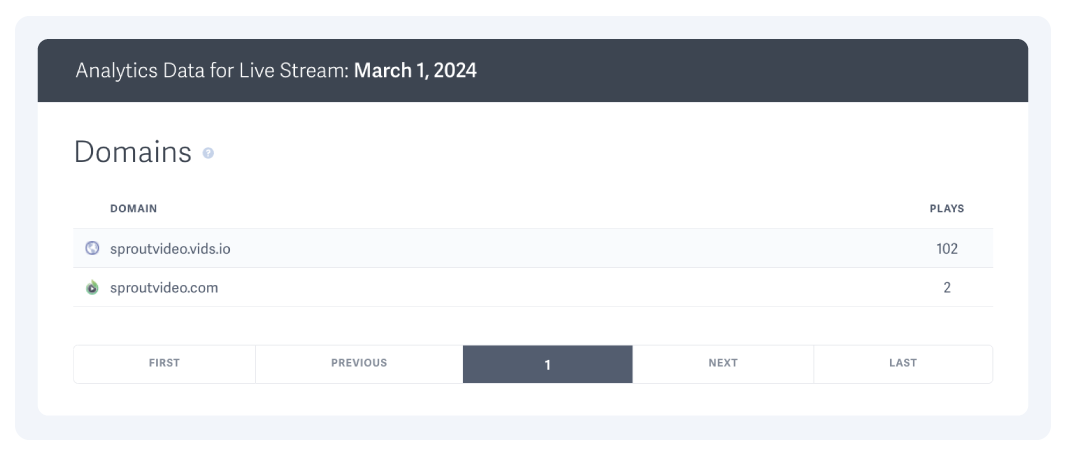
Data on domains is also helpful when auditing security for private live streams: you can easily ensure only viewers from intended domains watched the live stream.
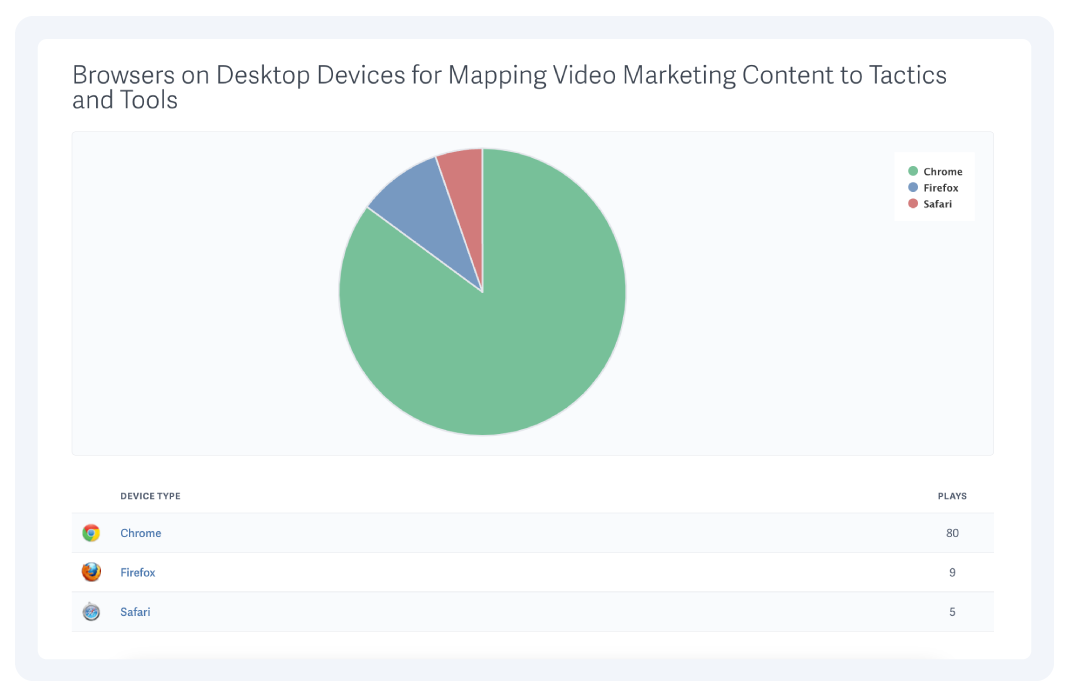
11. Device Type
Determine the device, browser, and operating system used to watch your live stream.
This information provides insight into your audience’s viewing behavior and preferences, which is helpful when creating a marketing strategy. It can also inform how to optimize your live stream’s landing page.
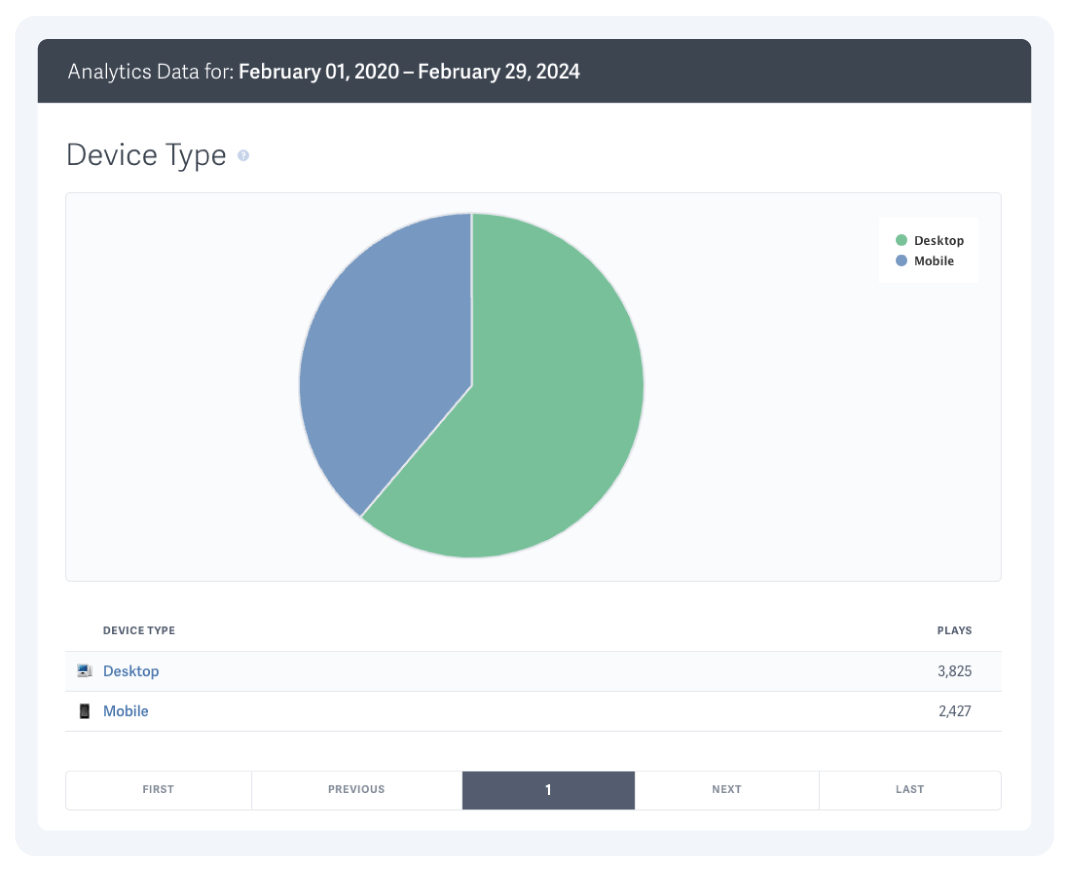
On the SproutVideo platform, click on each device type to view more in-depth information.
Individual Viewer Engagement Data
Post-live stream analytics provides a bird’s-eye view of metrics for a specific live stream. Individual session data, on the other hand, provides data view-by-view.
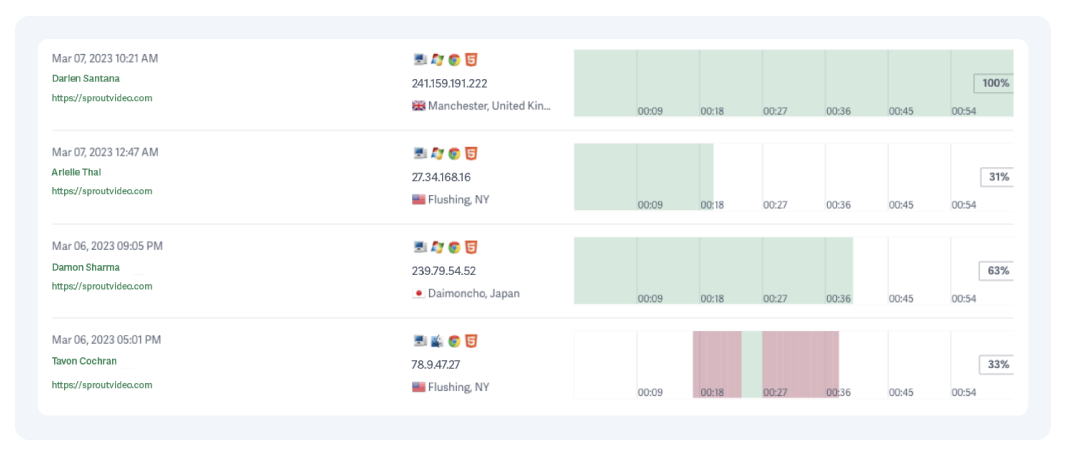
There is some overlap between post-live analytics and individual session data. The difference between the data is whether the information pertains to the entire live stream or a single view.
This overlapping information includes geographic location, domains where viewed, and the device type. Click on each metric to return to its section above. Check out the other available individual session metrics below.
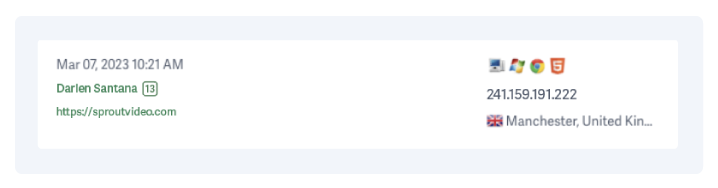
12. Date Viewed & Time Stamp
The day the viewer watched your live stream and at what time (in your time zone).
This metric conveys when each viewer tuned into your live stream. The dates will be the same for any single live stream.
This information is helpful for diligent record-keeping, especially in regulated industries.
13. Viewer Name with Total Live Streams Viewed (When Captured)
The names of viewers whose contact information has been tagged.
You can track specific viewers if their information has been captured or tagged.
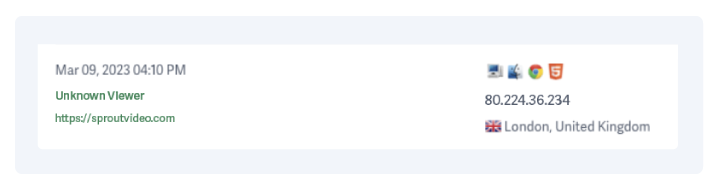
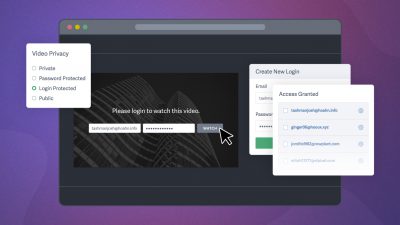
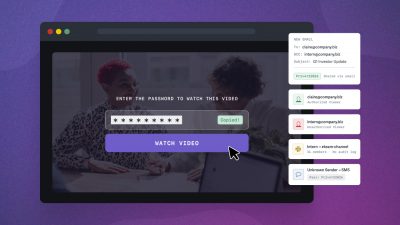
Log-in protection is a common way to do this. When the viewer watches a live stream after logging into their account, their name appears instead of “Unknown Viewer.”
Tagged viewers will also include a small box next to the name that indicates the total number of live streams the user has watched.
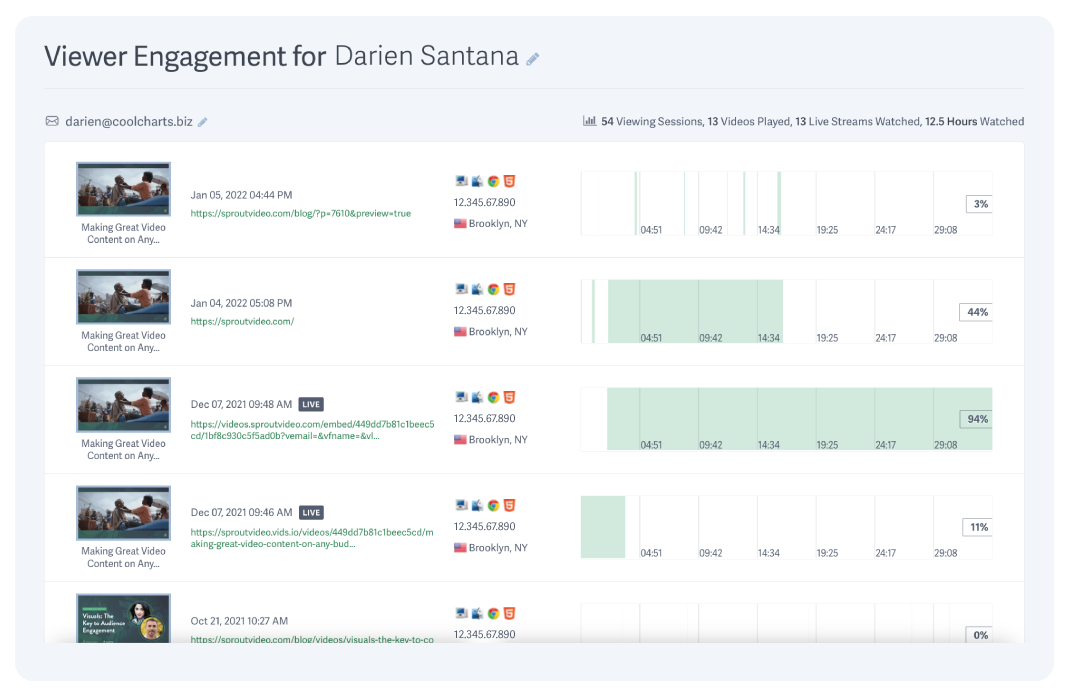
Click on any individual session, including “Unknown Viewers,” to view all of the viewing sessions (across live streams and videos) recorded for that user, as well as their total time watched.
The practical applications for this information are abundant.
- Monitor participation in employee training and educational lectures.
- Use the information to tailor or segment marketing campaigns.
- Track individual viewers to ensure compliance in regulated industries.
Note: When a live stream is viewed internally by a logged-in SproutVideo account user, the viewer session data will feature a small box that reads, “Internal.”
14. IP Address
The IP Address associated with each view of the live stream.
IP addresses are collected to identify viewers and their location.
Track this information to audit the security of live streams while employing IP address whitelisting, which is a security measure that makes streaming content available only to viewers with approved IP addresses.
15. Heat Map
A cool-to-warm visualization for individual viewer engagement data.
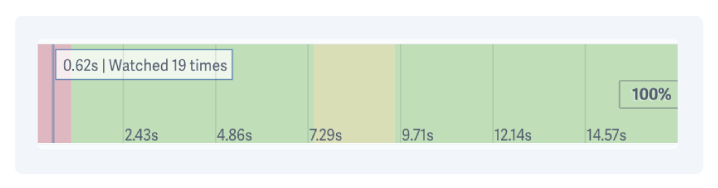
At a glance, “heat spots” indicate where the viewer rewatched content. Rewatches indicate areas of greater interest or sections of information that are too dense to absorb the first watch. Portions of the live stream the viewer didn’t watch are white space.
This map also includes the percentage of the total live stream the viewer watched. This information allows you to determine how much of the live stream a viewer completed during any one session.
Note: Download live stream data as a CSV for offline viewing and easy record management with the SproutVideo Forest plan — built for businesses and institutions. These downloadable reports are Live Stream Event Analytics, Engagement Data, and an Access Log (for log-in-protected live streams).
Recorded Live Streams Become On-Demand Videos
When your broadcast ends on the SproutVideo platform, the live stream is automatically saved and inherits its privacy settings.
Live streams embedded on public and private web pages update with the on-demand video version. Therefore, it automatically becomes available to watch for viewers with access.
Once a live stream is recorded and shared as an on-demand video, all the regular metrics for video streaming are tracked and available within your video library.
Learn more about mastering the video metrics game.
5 Live Streaming Use Cases for Business + Metrics to Track
Effective live streaming starts with clear goals. Here are some common ways businesses use live streaming, alongside example goals and the metrics needed to evaluate success.
Note: Click on each of the “Metrics to Evaluate Success” to learn more about it.
1. Optimize customer journey & tailor marketing efforts
Goal: Create highly engaging live streams to encourage loyalty and interaction with the brand. Employ insights gained from highly engaged viewers in the brand’s overall marketing strategy.
Metrics to Evaluate Success:
- Average engagement rate: Evaluate overall success by how much content viewers watched. Additionally, compare the engagement graph with the live stream’s content to identify successful aspects and areas for improvement.
- Qualitative engagement data (i.e., live chat participation): Review participation to discover highly engaged individuals likely to build emotional investment with your brand.
- Heat maps. Track individual viewer engagement to tailor marketing efforts or segment your audience based on topics of interest.
- Domains Where Viewed: Determine what channels most effectively drive viewership to the live stream based on where viewers tune in.
2. Influence purchasing decisions & increase activations
Goal: Engage leads by solving product-related problems to drive interest in company products or services. Track attendees’ post-live stream engagement with your website (i.e., shopping cart checkout, requesting a demo, subscribing to free resources, repeat purchase) to measure success.
Metrics to Evaluate Success:
- Average Engagement Rate: Determine how much content average users watch to determine the significance of live stream engagement on purchasing decisions.
- Heat Maps: Discover highly invested contacts and gain insights into viewer content expectations; use this insight to improve future live stream engagement.
- Viewer Name: Review engagement data for each session to see how the live stream influenced individual viewers. Tag users and compare these insights with your customer relationship manager (CRM). For unknown viewers, track the Viewer ID given (each viewer receives a unique Viewer ID).
3. Maintain compliance with regulatory requirements
Goal: Ensure compliance with regulations and data privacy standards in relevant industries (i.e., finance, healthcare, legal services.) Maintain records of compliance for specific users.
Metrics to Evaluate Success:
- Viewer ID or Name: Track and review engagement data for each viewer to ensure all compliance materials are watched. Log-in protection (or Single Sign-On) through the SproutVideo platform is an easy way to do this.
- Heat Maps: View engagement data for each viewing session visually. View all sessions for any single viewer to determine if the user started a live stream and finished it later.
- Total Minutes Watched for an Individual Viewer: Track time input for compliance regulations that require certification or continuing education hours. Within individual viewer engagement data on the SproutVideo platform, click on the viewer to see the total minutes watched across both live streams and videos.
4. Onboard new hires and improve employee skills
Goal: Track employee or student engagement with educational materials to ensure proper training. Easily gain insights into participation and engagement for future improvements.
Metrics to Evaluate Success:
- Viewer Name and Total Live Streams Viewed: Utilize tagging to assign viewer names to their Viewer ID (used to track sessions). Then, review session data for individual users to track engagement with live streams and completion rates.
- Heat Maps: Use this information to determine if the user started and finished a live stream later and how much of the live stream they completed.
- Unique Visitors: Audit live stream security measures by reviewing the unique visitor metric. If this number exceeds the limited audience for a private live stream, investigate individual session data to determine the cause.
5. Communicate across company teams privately and efficiently
Goal: Host secure live streams to communicate effectively across teams and multiple branches, inform shareholders, and collaborate on pre-launch content and marketing materials.
Metrics to Evaluate Success:
- Unique Visitors: Ensure communications reach the intended amount of people. Investigate individual session data if the number exceeds the intended audience size for a private live stream. The SproutVideo platform identifies account users as “Internal,” making it easier to separate internal and external security breaches.
- Average Engagement Rate: Evaluate how much live stream content viewers watched. This metric is essential for determining whether the audience received the knowledge and information from the live stream.
- Geographic Location: Track viewer location to ensure communications reach all intended parties or branch locations.
Note: SproutVideo accounts include security tools like password protection, login protection (including single sign-on), and whitelisting for domains, IP addresses, and geographic locations.
Ready to launch your live stream? Grab our 30-day truly free trial. Or learn more about live streaming with our other content: