
Video engagement accurately represents the connection you’ve forged with an audience.
It showcases the likeliness of videos increasing awareness, sales, and retention. Additionally, 98% of enterprise organizations credit video for better and faster employee training and improved internal communications.
However, video production is a scalability challenge for many companies and organizations because of their required resources. To address this challenge, optimize each video for viewer engagement and get the most out of your video budget.
We’ll cover ten strategies for increasing video engagement — try incorporating one or two of these ideas into your next video!
How to Measure & Improve Video Engagement
- What is Video Engagement & Why Should I Measure It?
- 10 Strategies for Improving Video Engagement
- Understand Your Viewer’s Motivation
- Connect Emotionally with Viewers
- Add Subtitles or Captions
- Hook Viewers in the Opening or Introduction
- Expand Video Reach with SEO
- Use Sound, Visuals, and CTAs to Hold the Viewer’s Attention
- Create Effective Thumbnails
- Optimize Videos for the Intended Distribution Channels
- Include Interactive Elements for Deeper Learning
- Edit, Refine, and Replace Videos Based on Engagement
- Dissecting a Video That Nails Engagement
What is Video Engagement & Why Should I Measure It?
Video engagement measures how people interact with your videos. It’s one of the best ways to determine whether or not the intended audience is receiving your message.
Commonly, video engagement is a key performance indicator (KPI) used by professionals to evaluate, measure, and improve the performance of video content.
Here are four video engagement metrics to measure and what they reveal.
- Play Rate: how likely someone is to play your video. A high play rate percentage suggests the video grabs enough attention to encourage views. When low, consider optimizing your title, thumbnail, and whether the video aligns with the page topic.
- Average Engagement Rate: how much of the video engaged viewers. Along with its accompanying graph, this metric is useful for determining the percentage of video content watched and where viewers lose interest.
- Heat Mapping: viewer engagement habits expressed on a cool-to-warm color scale. It visually represents what parts of the video a user watched, rewatched, and skipped over.
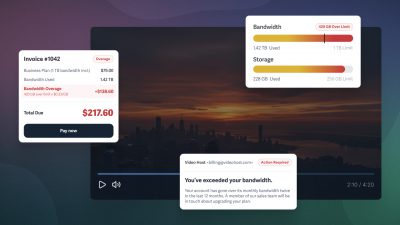
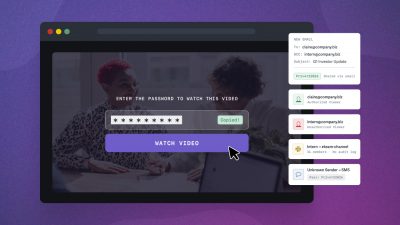
- Individual Session Data: data on who viewed the video, from what device, and where. Every viewing session collects data. Use this data to tailor marketing efforts, audit secure video access, track user completion rates, and more.
For example, Learning & Development professionals will likely optimize videos for optimal information absorption and track individual completion rates. On the other hand, marketers might track the average engagement rate and incorporate CTAs to move leads down the funnel.
🌱 Video Metrics: How to Measure, Evaluate, and Increase Engagement
10 Strategies for Improving Video Engagement
1. Understand Your Viewer’s Motivation
Viewer motivation has a measurable impact on video engagement. Internally motivated viewers produce higher engagement rates than those motivated by external rewards or consequences.
- Internal motivation is when a viewer watches a video for enjoyment or to satisfy their curiosity.
- External motivation means the viewer is watching to gain something, such as impressing their new boss by seamlessly onboarding.
For example, Notion is a fun productivity app built for individual customization. If a viewer is excited to learn how to use it, a 30-minute video on Setting Up Notion Step-by-Step is worth the time in the viewer’s mind. The inherent satisfaction they expect to receive will increase their engagement in the video when the value is delivered.
On the other hand, new hires engage with training videos to maintain employment and showcase their value to employers. They aren’t engaging with the video from an internal drive but rather an external desire to maintain good standing at work.
For example, a video on Everything a New Employee Needs to Learn on Day One will be more engaging when split into six shorter five-minute videos rather than one long 30-minute segment.
Consider your audience and balance the length of your videos with
- the value of the information provided
- the viewer’s intrinsic motivation
In other words, you can inspire viewer engagement by appreciating what your audience finds valuable, insightful, and enjoyable.
2. Connect Emotionally with Viewers
An emotionally connected audience generates 52% more value than a highly satisfied one. Empathize with your viewers to identify how to incorporate emotion into your videos. Consider the viewer’s pain points, questions, and knowledge gaps. Then, prepare viewers for the emotional ups and downs while providing calls to action.
Hootsuite’s “Mean Tweets” product update video based on the Jimmy Kimmel Live series of the same name.
For broad appeal, many brands use light-hearted emotions, such as surprise (like the Generic Brand Video by Dissolve) and humor (or this TrueCar welcome video).
However, incorporating heavier emotional tones like grief, loneliness, and struggle (such as LifeStraw’s thank you video) can be especially powerful when the emotion is transformed in the video.
Here are examples of how you might use emotion and storytelling to drive engagement:
- Highlight or emphasize an external or internal conflict and showcase the resolution
- Use The Hero’s Journey to inform story beats and create a satisfying story
- Give the video (or main character) a goal: follow the journey to reward and share it
- Align video topic (or the character’s fears and desires) with those of your audience
You can incorporate storytelling elements in every type of business video to contextualize the content and build emotional investment in a product or service.
3. Add Subtitles or Captions
Viewers are 80% more likely to finish a video with subtitles. They also increase information absorption by enabling people to watch and read the content. Finally, subtitles are important for viewer accessibility.
🌱 How to Add Subtitles to Your Videos Easily
4. Hook Viewers in the Opening or Introduction
Encourage engagement for the entire length of a video — whether it’s 15 seconds or 30 minutes — by centering, teasing, or jumping directly to the core valuable idea.
Consider, “What about this topic is enticing, valuable, or entertaining?” Use the introduction to explain or illustrate the core idea helpfully or satisfactorily to the viewer.
A video’s introduction should be concise and relative to the video’s length. Here are some examples of how to use the introduction to keep viewers watching:
- Discuss what they will learn and how it will unfold (i.e., a brief table of contents)
- Open with an engaging shot or sequence that teases or encompasses the core idea
- Expand on the title’s hook and contextualize the pay-off
- Create a short skit that is relevant to the core idea of the video
Deliver on the promises of the video’s introduction to create viewer satisfaction.
5. Expand Video Reach with SEO
When a viewer is looking for specific information and finds your video, they are more likely to engage actively. Organic discovery puts your content in front of people who are directly seeking it.
Learn how to rank in search with these video SEO best practices, then use this guide on video metadata to get started.
6. Use Sound, Visuals, and CTAs to Hold the Viewer’s Attention
Elevate your video with thoughtful sound design, cinematography, and actionable takeaways. Think of it this way: every movie and television show builds an emotional atmosphere to create an experience. Everything from the casting, script, and storyboard to the location, camera angles, and color grading focuses on building the right vibe.
You may not have the resources or budget to mimic movie studios, but you can refine how you use sound, visual cues, and calls to action to bring dynamism to your videos.
Video creators commonly add onomatopoeia (i.e., “boing” or “ding”), b-roll video or gifs, background music, and on-screen text to maintain viewer attention. Utilize these ideas if they align with your brand and audience. Here are some other ideas for how you can use sound, visuals, and CTAs to engage and maintain viewer attention:
- Create effective calls to action by providing a resource or solving a problem
- Use sound and music to set pacing expectations for the viewer intentionally
- Add supplemental visuals wherever relevant to stoke interest and expand learning
- Include on-screen presentation slides, whiteboard sketches, or screencasts
- Combine these elements into a consistent tone to build audience trust
Much like a stage play in a black box theatre, the possibilities are endless. It’s about what you do with the tools and skills you have while being open to trying new things.
7. Create Effective Thumbnails
Effective thumbnails increase the likelihood that a user will click on a video. Thumbnails can be a still image from the video, an eye-catching custom image with subtitle text, or even an 8-second animated gif pulled directly from the video (available on SproutVideo).
Certain thumbnail elements, like faces and bright colors, lend to views. The end goal is to establish a brand-aligned look that consistently encourages clicks.
8. Optimize Videos for the Intended Distribution Channels
Where you embed or share a video greatly influences how you optimize it for engagement. A recruiting video, for example, will be different from a product demonstration, which is different from a social short (which also varies by platform).
Yet you could repurpose elements of a recruiting video or product demonstration to share on Instagram or TikTok, lending to diverse content and added value. In other words, consider tailoring your videos to match each intended distribution channel.
Our first episode in a three-part series on color grading.
If you plan to share a video across multiple platforms, consider creating separate versions of the same content to optimize engagement for each channel.
Making multiple marketing assets from a single video is not a new concept. Just like B2B video marketing has different best practices than video marketing for e-commerce, there is no one-size-fits-all approach to effectively repurpose content. In other words, don’t compare your audience to another. Find out what your audience values.
The condensed social media version of the long-form episode above.
Here are some examples of producing multiple versions of a video to tailor it for specific distribution channels:
- Share compelling 30-second or less clips from a longer-form video (i.e., promote a podcast episode by making several shorts from the most watched moments).
- Create a 2-minute, 1-minute, 30-second, and 15-second version of an advertisement and A/B test to determine what performs best in different situations.
- Provide part of a paid online video course for free to generate interest in the course and build trust in the level of information provided.
🌱 Four Secrets to Optimizing Video for Social Sharing
9. Include Interactive Elements for Deeper Learning
Quizzes, checklists, and discussion questions are examples of interactive elements that lead to improved information retention. Quizzes, for instance, improve information retention by 25%.
Interestingly, interactive elements increase engagement in B2B and B2C scenarios. Lead generation, web traffic, sales, and referrals all increase alongside overall video engagement.
Create interactive elements by considering the next steps your viewer needs to take. Provide solutions for the viewer with supplemental resources (such as a downloadable PDF summary) or tools for applying the knowledge learned (like a step-by-step checklist on what to do).
You can also use interactive elements to direct viewer attention during or after a video with in-player CTAs and post-play screens.
Engaging Educational Videos Made Simple

For Ethan Anderson—Director of Product with NOLA Education—video engagement is the difference between student success and failure.
10. Edit, Refine, and Replace Videos Based on Engagement Data
So, you published a video on your website that didn’t perform as desired. Instead of returning to the drawing board, use video engagement metrics to determine what parts of the video aren’t resonating with viewers or where they lose interest.
On the SproutVideo platform, the Engagement dashboard features a graph showing the percentage of viewers engaged with your video throughout its duration. The graph lets you pinpoint the parts of the video that people engage with most and where you’re losing them.
You can view the average engagement rate to determine how much of your video people watch. A low overall engagement rate suggests that viewers aren’t receiving the value intended from the content.
Here are some ideas for evaluating the data to improve engagement:
- Look for spikes, which highlight areas with increased audience engagement or rewatches. Drop-offs highlight a significant decline in engagement or parts of the video viewers skipped.
- Engagement above 100% indicate video rewatches. Rewatches highlight heightened interest or information too complex to absorb on the first watch.
- Play rate (impressions/views) tells how likely people are to click on your video. A new thumbnail, title, or video placement can improve a low play rate.
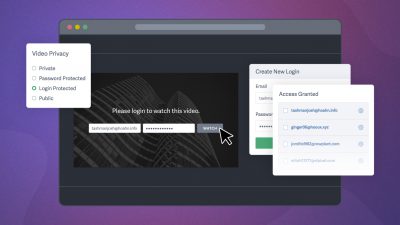
You can also review heat mapping data collected for every individual view session on the SproutVideo platform. Heat maps visually display what parts of your videos individual viewers watched and rewatched. This data is ideal for reviewing student or employee engagement and spotting sessions from viewers who shouldn’t have access.
Once you’ve determined how to improve the video for increased engagement, you can easily replace the old version with the new one. SproutVideo preserves all historical analytics data.
Dissecting a Video That Nails Engagement
Content creators rely on engagement to generate income. While a business’s applications and goals may differ, organizations can incorporate engagement strategies from highly successful videos to elevate brand content.
Take this video by YouTube creator Phil Edwards, for example. Phil combines many of the strategies above in his video production, resulting in a video that’s hard to stop watching.
Here are three ways the video above successfully employs engagement strategies:
1. The video opens with a skit related to the core idea.

2. Phil hooks the viewer by relating the trend to world history. He teases this information and circles back later.

3. Sound, visuals, and editing create dramatic effects throughout the video.

Any of these elements can be strategically incorporated into business videos. Consider your goals, review the data, and make informed choices to improve video engagement.
Video best practices, like trends, are in a constant state of change. Fight the urge to follow fluctuating advice.
Focus on what your audience craves from you. Doing so won’t just increase your video engagement — it’ll increase viewer satisfaction and your bottom line.