
Traction is the early support from your target customer base that allows you to quite literally “get the ball rolling.” Like a runner sprinting off the line, you need good grip to get started. If the support is continuous, and grows in numbers, the runner moves faster and more efficiently as they accelerate. The runner, of course, is your business, and their momentum is ideally an upwards peak in customers!
While traction is primarily used in the context of early stage startups, it also applies to companies in any stage of development. For instance, when launching new product lines, rebranding, or continuing to expand at a healthy rate.
In this post, we’ll share video metrics that are helpful in measuring and improving traction for each stage of growth. These tips apply whether your company is barely more than a daydream, or already a well-established brand.
Stage I: Pre Product-Market Fit
Marc Andressen, who coined the term, defines product-market fit as, “being in a good market with a product that can satisfy that market.” Once you’ve achieved product-market fit, your company should begin to take off.
Before your company reaches product-market fit, it is important to start tracking metrics to measure traction over time. That way, you can evaluate whether you should stay the course, or pivot.
Kickstarter is where many early stage companies get their start. Not surprisingly, many of them leverage video to get potential investors excited about their product. Consequently, it’s a great place to find brands making videos that can give them insights like these, such as CYCL’s successful campaign.
Using this example, let’s identify the video metrics that will help you to measure traction metrics:
Repeat Views
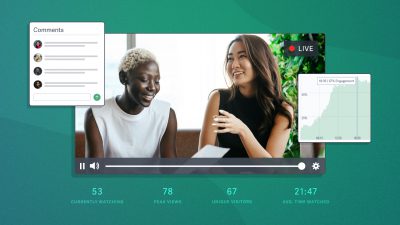
Average Video Engagement indicates which parts of your video get repeat views, and where your viewers drop off. It’s part of SproutVideo’s viewer engagement metrics reporting. What can this data tell you?
If a lot of viewers rewatch a particular segment, it could be because they don’t understand something and you should provide more information in the video, in another video, or on your website.
For example, CYCL does a stellar job of explaining why their product is needed and how it works. However, a legitimate concern of a cyclist watching their video might be, “Well, do these fit on my bicycle?” since not all bicycle handlebars are the same size.
If this was the case, CYCL might notice that a lot of viewers rewatch the part of the video that shows how the product fits onto bicycles starting at minute 1:08. It might be worth it to edit this video to be more explanatory about that aspect. They could also create additional content (video or otherwise) that addresses the concern.
Retention
If a viewer drops off – and especially if you notice many viewers dropping off around the same point in your video – it could be that they are bored or that your video is too long.
If you think it’s the former, try creating a new video with different information to see how it affects viewer engagement. For the latter, try breaking up your video into segments and creating a playlist. You could also test simply shortening your video.
Referrals or Word of Mouth
At this stage, and especially for newer brands, referrals are extremely valuable. New brands haven’t yet built the brand awareness or brand recognition that can make people automatically trust what they’re offering. However, it’s no secret that people tend to trust recommendations from people they know.
Social sharing is already built into our player so that viewers can easily share your videos with their networks. You can also kick it up a notch by including a Post-Play Call-to-Action that encourages your viewer to share via social media or email.
Revenue
It’s possible in the pre product-market fit stage that your offering is not yet available and tracking revenue isn’t possible… or is it?
CYCL’s Winglight’s were not going to be available for another six months when they first shared their video on Kickstarter, but that didn’t stop them! They eventually raised twice the amount they’d hoped for prior to launching their product.
Using our Post-Play Call-to-Action feature, you can lead people straight to an pre-order page or form for your product. If you’re not comfortable doing that before you’re able to begin delivering on it, you can use the Post-Play Call-to-Action feature to encourage people to sign up for email updates and announcements so that they’re the first to know when your product is available.
Whatever you use it for, track the rate at which traffic and conversions from your Post-Play Call-to-Action grow over time.
Stage II: Growth Stage
The growth stage comes once your start-up has, well, started up, and is beginning to generate revenue from sales. It’s still vital to track as many metrics as possible to analyze traction and growth. You need to ensure that your consumer base is expanding and your business tactics are working effectively.
For example: Uber.
There are few cities worldwide that Uber doesn’t operate in. It has climbed to the top of efficient transportation across the United States. It’s safe to say Uber is no longer in the early stages of its development.
However, their earlier promotional videos, such the one above from early 2013, zero in on their mission statement, and introduce people to their goals for the business. At the time, the service was beginning to expand to other countries and gaining a lot of attention.
This type of video helps position the company for growth in new markets by explaining its value proposition. Notice that they address not just passengers, but drivers too.
Metrics to Track
All of the traction metrics we discussed in the pre product-market fit stage (repeat views and retention, referrals, and revenue) still apply in the Growth Stage. In addition, you also want to closely monitor Unique Impressions, Unique Views, and Viewer Location. All of this data is available in SproutVideo’s analytics reporting.
Seeing growth in Unique Impressions and Unique Views week over week means that more people are becoming aware of and are interested in your product. In other words, you’re gaining traction.
While not a growth metric on its own, Viewer Location trends can still provide you with valuable insights as your company expands to new markets.
For example, Uber might have noticed that a lot of traffic for their video was coming from a particular city that wasn’t previously on their radar. Looking at the data, it might be worth a second look.
Or, say Uber ran an on-the-ground marketing campaign in a particular location at the same time they launched this video. They could use use Viewer Location data to determine if that marketing effort drove traffic to their video. If it did, that on-the-ground marketing campaign might be worth replicating in other places.
Stage III: Revenue Generation Stage
As the name suggests, the revenue generation stage is the point at which your business is consistently turning over profit and steadily growing as a company. At this stage, you should focus on retaining existing customers while continuing to grow.
Metrics that matter in the revenue generation stage include acquisition costs, customer lifetime value, and churn rate. By accompanying these metrics with analytics data from your videos, you can get a clearer picture of what’s working.
A little company named Facebook comes to mind for this one.
Facebook is a great example of a big name company using a video campaign to measure business traction while in the revenue generation stage. This April 2018 video was released worldwide in the interest of damage control after the recent Cambridge Analytica scandals.
The video serves multiple purposes. It reassures the public that their data is safe, reminds them why they use the site, brings the purpose of the site back to its roots, and helps retain its user base. Facebook can consequently compare the analytics of the video – how many times it has been seen (and in which countries) – with the loss/rise of active account users.
By leveraging video data, you can better understand whether you are gaining or losing traction at different stages of your company’s growth. Now that you know some of the video metrics that are most useful for measuring traction, tell us what you’ll be monitoring in your next video. Let us know in the comments or on Twitter @sproutvideo!