Research projects that online video traffic will quadruple by 2020. To take advantage of this compelling trend, it’s critically important to optimize your video marketing strategy to make sure you’re getting a good return on your investment. Professional video hosting providers, like SproutVideo, can furnish you with an array of analytics tools to help.
Here’s a brief overview of the metrics that we think will help you a) judge the success of each video, and b) create videos that perform better.
Plays (and Unique Plays)

What is it?
This metric is pretty self explanatory. The number of plays tells you how many people watched your video.
Plays are different from impressions. An impression occurs when your video is loaded on a webpage. Impressions will indicate the number of times your video is displayed to a site visitor, whether it’s played or not.
Note: “Unique” refers to the number of times a brand new user played your video. If the same viewer were to watch the video several times over any period of time, they would only count once towards the unique plays metric.
How Does It Help You?
The plays metric makes it simple to determine which of your videos are being watched the most. It helps you nail down what your viewers are looking for so you can produce consistently fantastic videos. In the same vein, this metric will also tell you which videos are duds. Hopefully, you can then avoid making similar mistakes in the future.
High Performance
Judge performance by comparing the performance of an individual video against the aggregate video analytics for your account. Use the aggregate analytics as a benchmark. Then, identify the videos that are doing significantly better, or worse.
As you track your progress, and take steps to make your videos more engaging, judge performance of videos by increases in plays over time. If you’re trying to attract new visitors, look at unique plays instead.
Play Rate

What is it?
The play rate is the percentage of people who see the video on a page and actually click the play button. We calculate this by dividing the number of plays by the number of impressions. If your video was displayed 100 times last week and 50 people watched it, your play rate is 50%.
How Does It Help You?
This metric will help you determine what works in terms of getting people’s attention, and actually getting them to click the play button. Being able to track play rate over time allows you to see if changes to your website or video impacts the play rate.
Essentially, the play rate metric allows you to make informed decisions about how your videos are displayed on your site. Is the poster frame eye-catching enough? Is the surrounding text appealing?
There are some common fixes you can try to move the needle on play rate. Make sure your video is prominently displayed on the page, and above the fold. Try auto-playing it, changing the poster frame, or adjusting the text on the page. If you include a specific call-to-action asking people to watch the video, you might be surprised by how many more people actually will.
High Performance
The average play rate across every single video on SproutVideo is around 17%. If your videos have a play rate much greater than 17%, you’re probably doing really well.
You may find that your play rate is substantially different from the average of our customers depending on how you’re using video. For instance, auto-playing videos are usually close to 100%. Take a look at the aggregate play rate for all your videos to see which are performing the best.
Average Engagement and Engagement Over Time

What Is It?
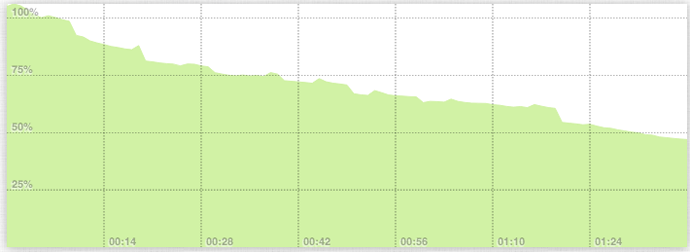
Unfortunately, your viewers have busy lives and plenty of things competing for their attention. As a result, they often don’t watch a video to completion. Engagement metrics tell you how much of the video your viewers have seen. They can also indicate the parts viewers skipped, or when they stopped watching.
How Does It Help You?
If the average drop-off point is early in your video, you can use this to evaluate several elements of your video. For instance, consider whether your video is too long, or if certain parts might be a bit dull. Then, you can make edits accordingly.
Conversely, pay close attention to the videos that people watch all the way through. Try to figure out what you did right — and keep doing it.
Other elements to test include the music, the pacing, and the voiceover for your video.
High Performance
The average engagement across all videos uploaded to SproutVideo with over 50 plays is nearly 63.5%. This should help give you a good sense of what to expect.
More important than average engagement, however, is making sure people are actually getting to the important parts of your videos. If most viewers are dropping off before you get to your call to action, your video is not performing well.
Device Breakdown

What Is It?
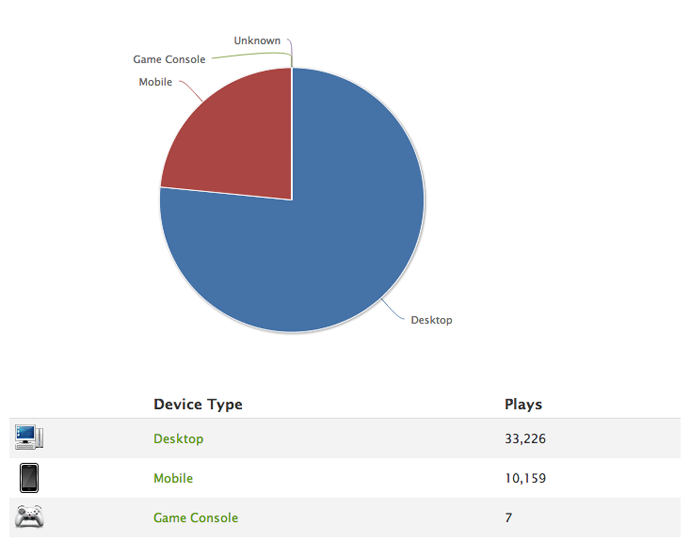
This metric breaks down the viewers by what type of device they’re using. For the most part, people either watch on a Desktop or Mobile device. On occasion, you’ll see someone watching from a game console like a Playstation, XBox, or Wii.
How Does It Help You?
The device breakdown is useful for determining how you should be optimizing your videos. If your audience is primarily on mobile, for instance, responsive video is key. Luckily, SproutVideo websites and landing pages are mobile-optimized already. We also offer responsive embed codes out of the box to make it easier to cater to mobile viewers.
High Performance
This depends on the audience you’re targeting with your videos. If you’re targeting a mobile device audience, make sure the percentage of plays on mobile devices is high and vice-versa if you’re targeting desktop audiences.
Geography Breakdown

What Is It?
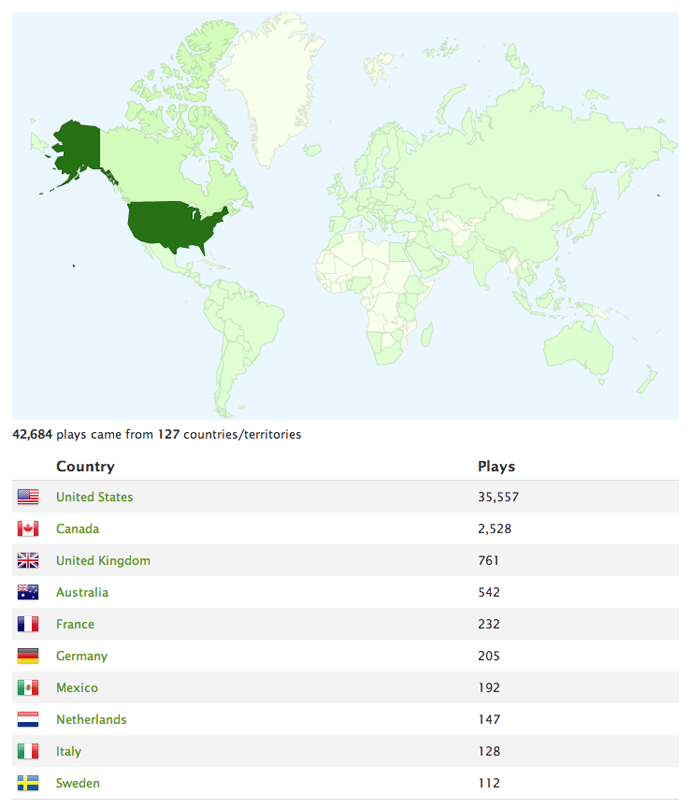
This metric tells you from where, in terms of country and region, your viewers are watching your videos.
How Does It Help You?
If you’re interested in tapping into an international market or increasing your global visibility (and who isn’t these days?), the geography breakdown will help you monitor your progress.
High Performance
This all depends on where you want your market to be. While many international companies shoot for US visibility, it’s also a benefit for American companies to grow awareness internationally. Choose markets that have a gap for your product or service (provided it’s exportable), and develop your seeding strategy to get your video watched in those places.
Domains Breakdown
What Is It?
This metric tells you where on the web people are watching your videos. Are they engaging from your website? From another site where your video is posted? This feature breaks it down.
How Does It Help You?
The domains breakdown will tell you whether having your videos available on bigger sites, or in multiple locations, is beneficial to driving views. It will also tell you where on the web your video is getting the most views, info you can use in your seeding strategy.
High Performance
The performance of your video in terms of reach (total viewers) is dependent on it being available and attractive on sites with high traffic. Tracking your success in individual domains will help you create a high-performing video.
Sometimes, you don’t want to grow your reach. In fact, if security is a big concern, this report can be useful in a very different sort of way. It enables you to ensure your videos aren’t being shared on websites that don’t have permission to share your content.
Ultimately, the metrics you use to determine what is and is not a high performing video will depend on the goals of your video campaign. Hopefully these metrics will help get you pointed in the right direction.
If you want to test these features out for yourself, we offer a free trial of our hosting services. There are no commitments, no credit card required, and you can try out our platform for free!
Do you have any questions about our features that we didn’t answer here? Feel free to leave a comment below, or you can catch us on Twitter @SproutVideo.


